CompLens
An AI-powered decision tool that calculates the real cost of a job, factoring in commute time, money, and energy, not just gross salary.
Live tool →No 1Context
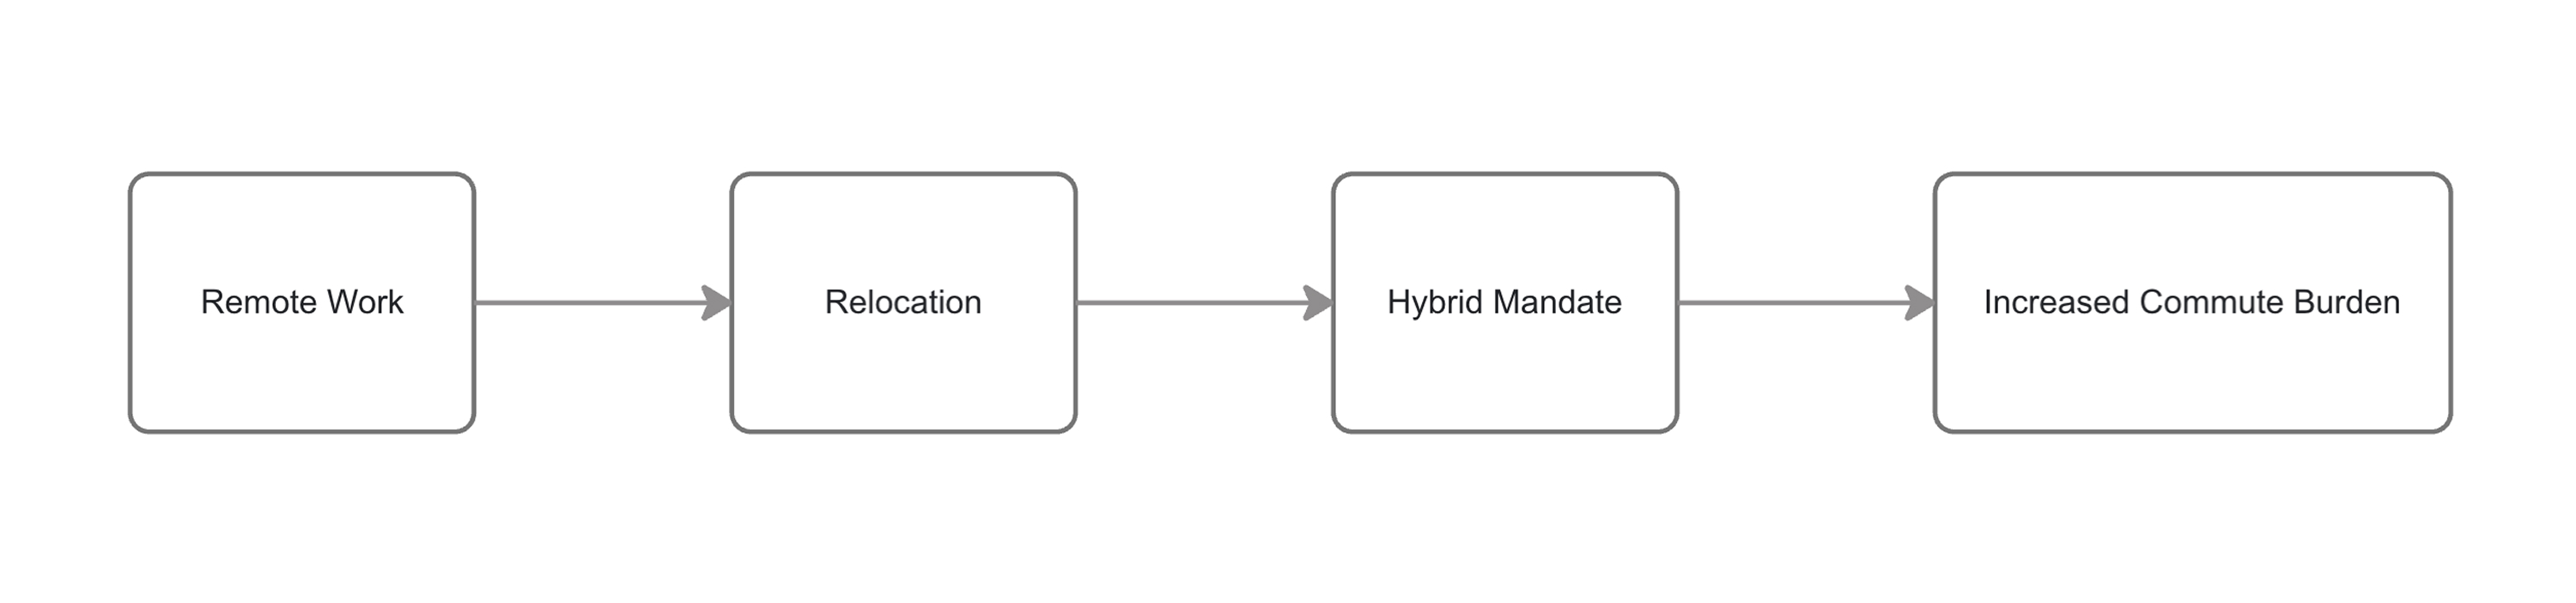
Remote work temporarily decoupled income from geography. Hybrid mandates reintroduced commute cost - but job platforms still rank by gross salary.
Workers relocated. Jobs recentralized. The comparison frame never evolved.
No 2Behavioral Problem
Commute cost is economically real - but behaviorally invisible.
It exists across time, money, and energy, yet is rarely translated into a comparable unit when evaluating job offers.
As a result, trade-offs remain implicit. Salary is concrete. Commute burden is abstract.
No 3Research Insight
Small increases in commute time equate to meaningful implicit pay cuts.
Yet salary is socially visible and identity-linked, while time loss is distributed and cognitively discounted.
The issue is not missing data - it is missing translation.

No 4Competitive Landscape
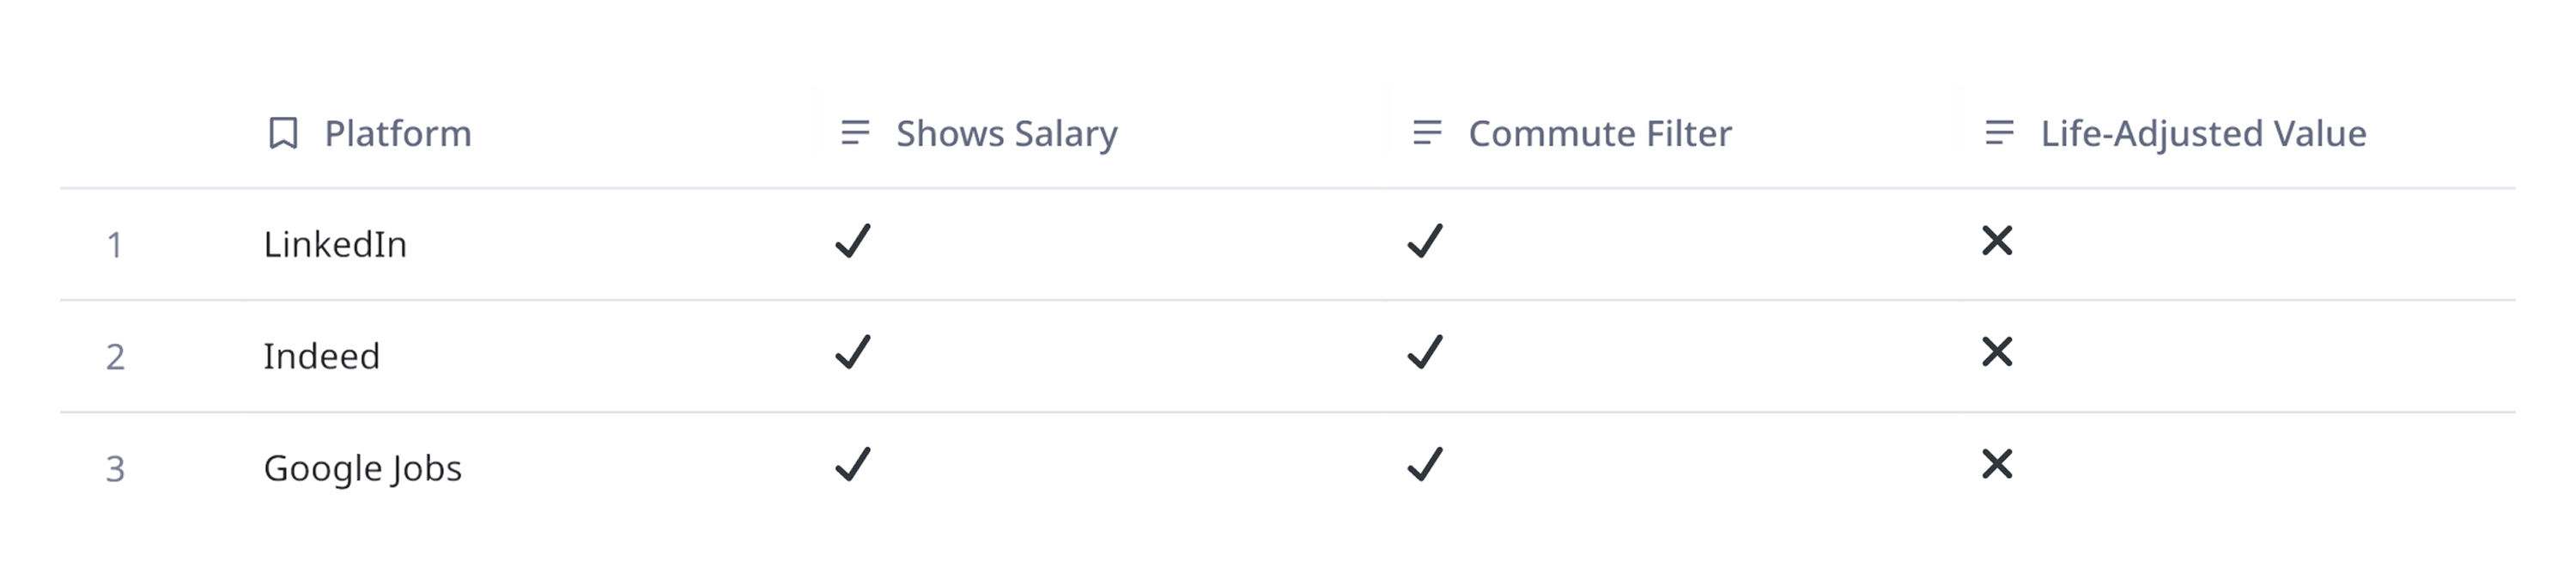
Major job platforms optimize for applicant volume and employer visibility - not life-fit.
Salary is clearly surfaced. Commute can be filtered. Net life-adjusted value is not modeled.
The omission is structural, not accidental.
No 5Product Concept
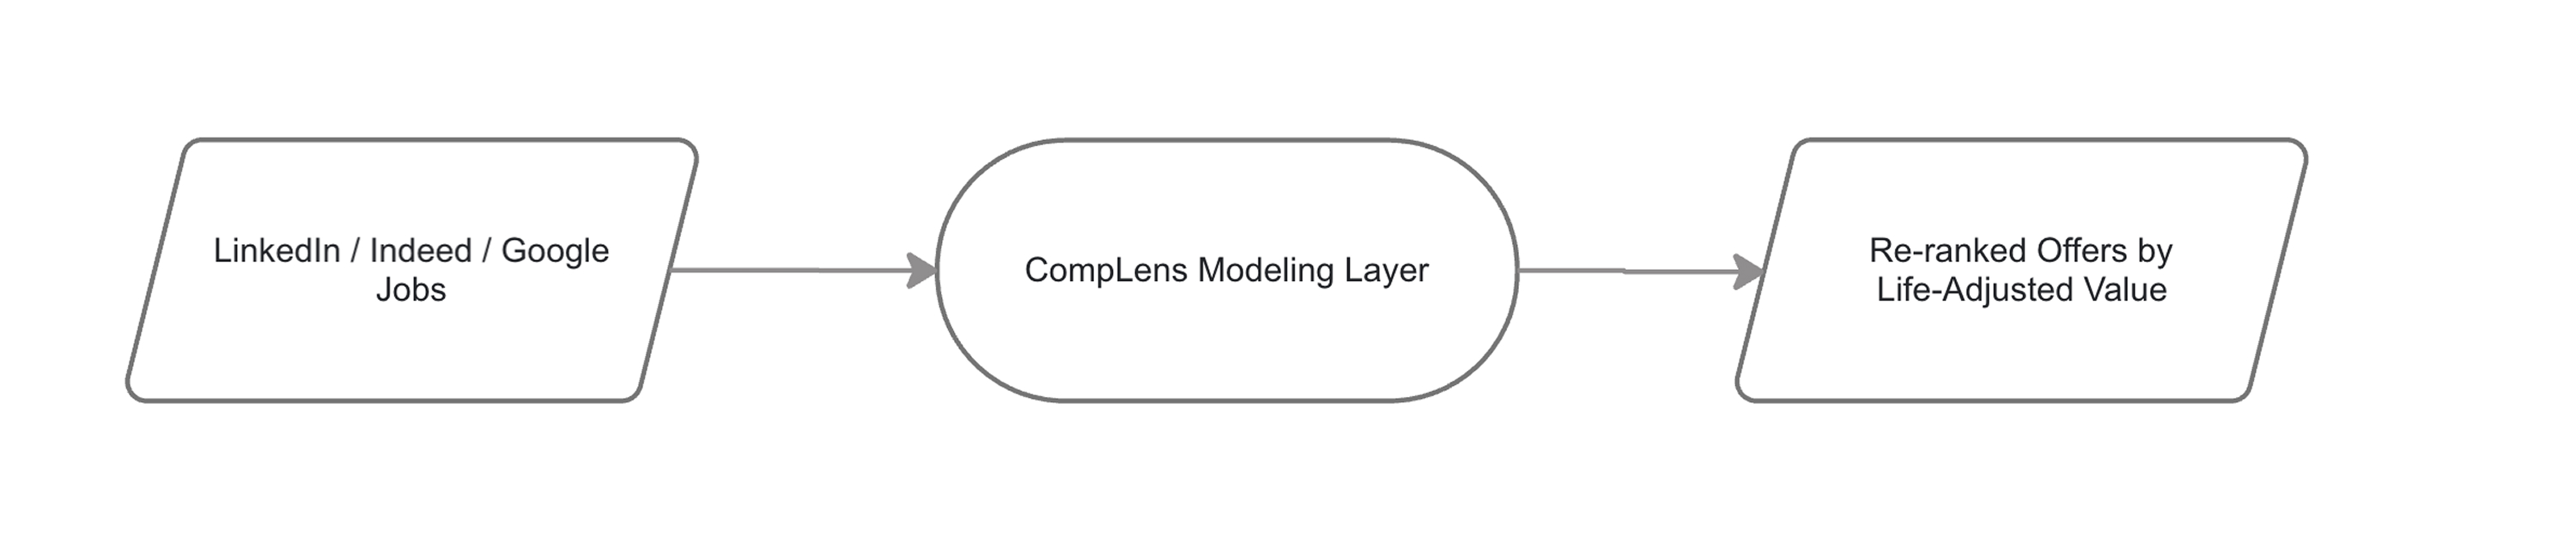
CompLens operates as a thin modeling layer - not a job board.
Users bring their shortlist from existing platforms. The system estimates commute burden, converts it into comparable value, and re-ranks offers accordingly.
AI assists in extracting job details, inferring hybrid frequency, and modeling life-adjusted value - while keeping assumptions transparent.
No 6Life Efficiency Model
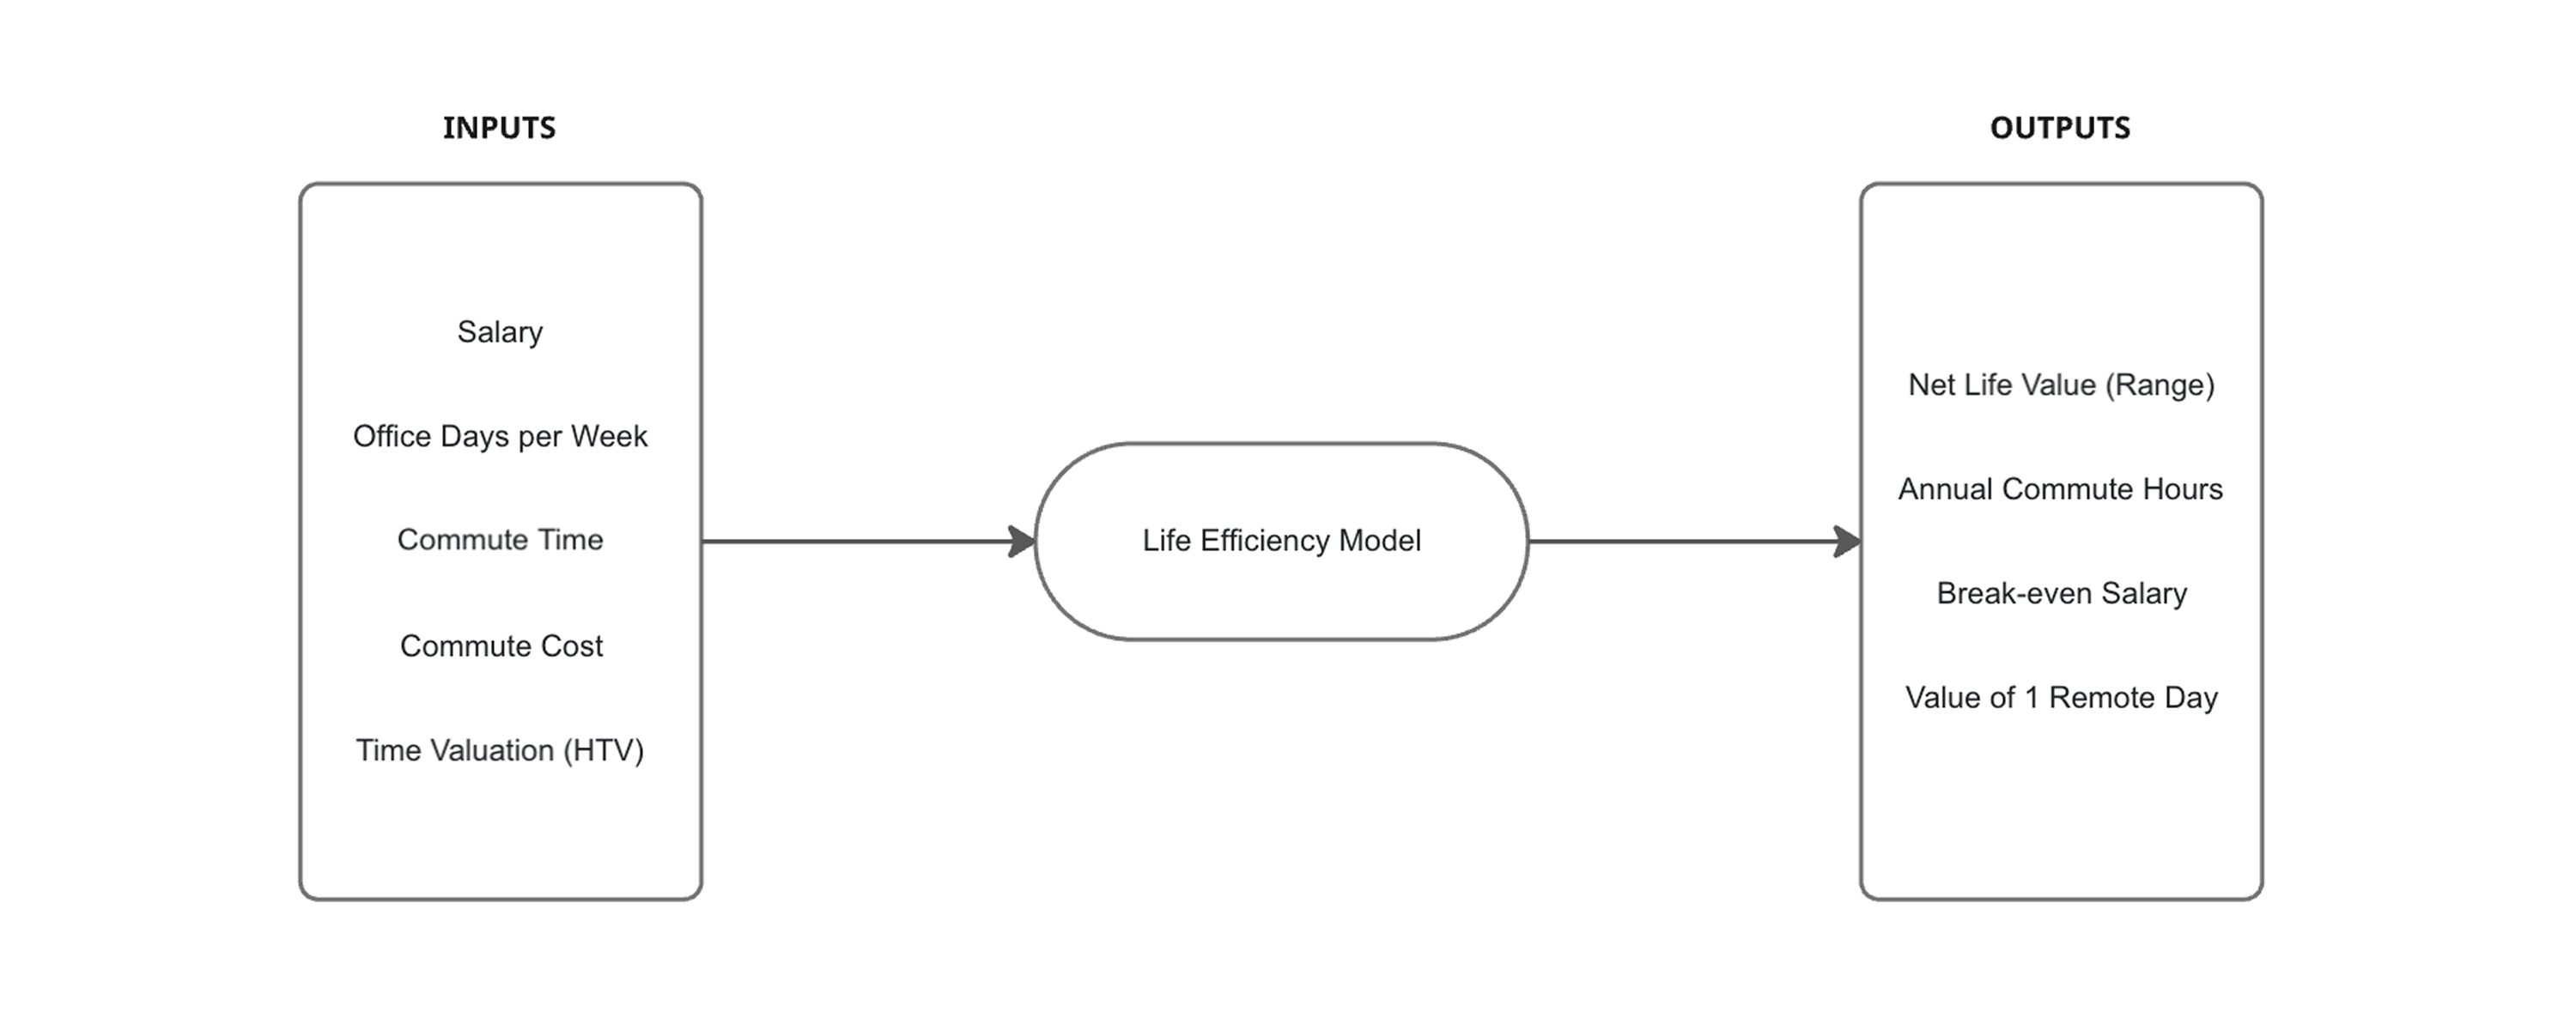
CompLens converts commute time into comparable economic value.
The model estimates annual commute hours, applies a user-adjustable time valuation, and subtracts both time and direct commute costs from net compensation.
The result is not a precise score - but a modeled range that enables fair comparison.
No 7Comparison Interface
CompLens starts with a single job, showing you exactly how much your commute is costing in time and money before asking you to compare anything.
If you have two offers to weigh, you can add a second job and compare side by side using a consistent life-value frame.
The interface prioritizes clarity over precision, surfacing assumptions and confidence bands where needed.

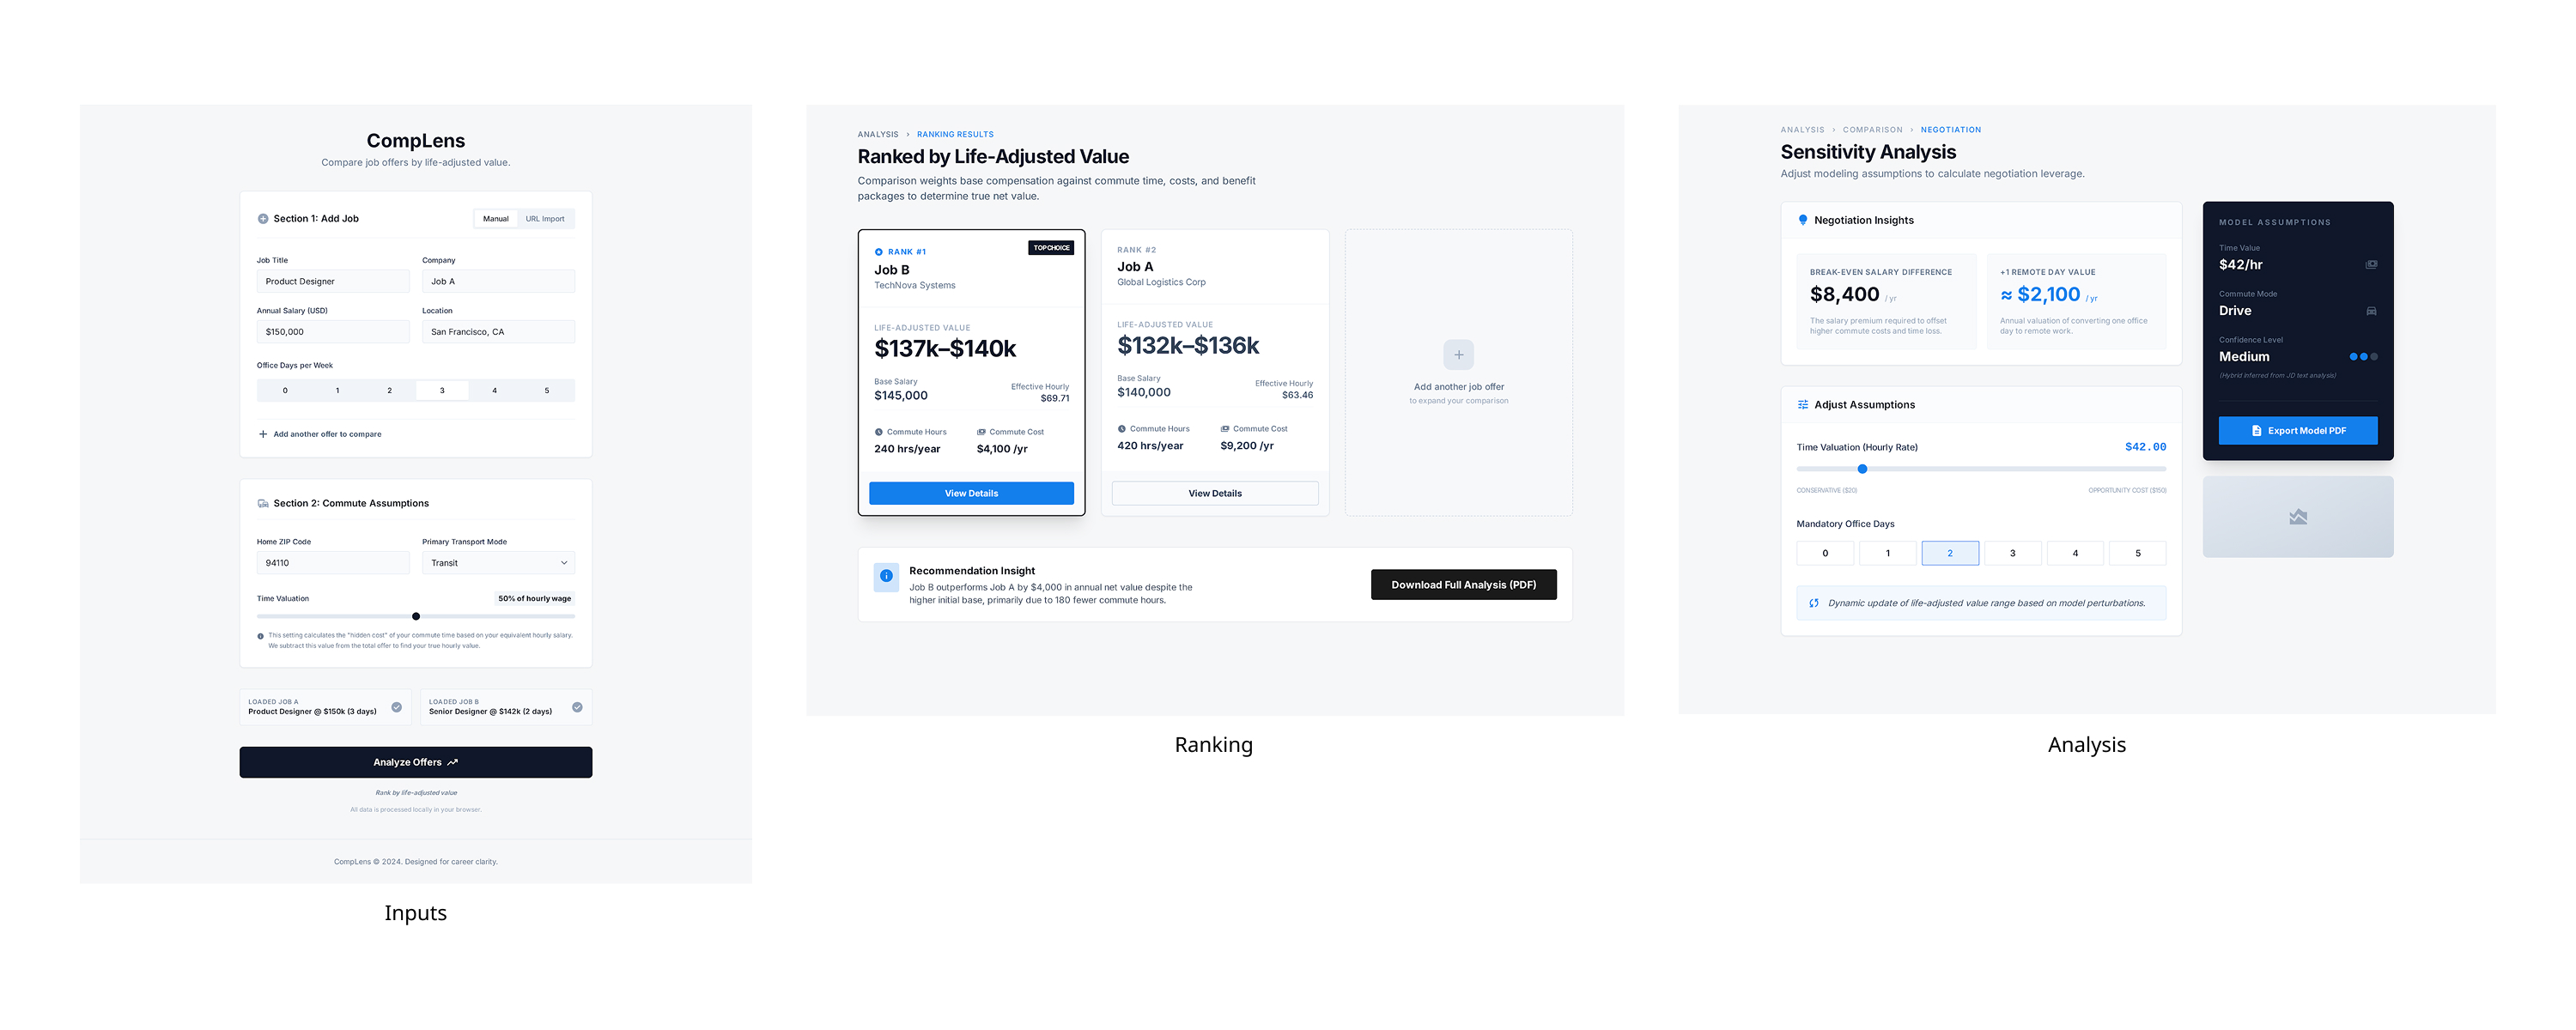
No 8Interaction Flow
The interaction flow is designed to surface assumptions before surfacing conclusions.
Users confirm commute inputs, hybrid frequency, and time valuation - ensuring outputs are interpretable and defensible.
The system prioritizes transparency over automation.
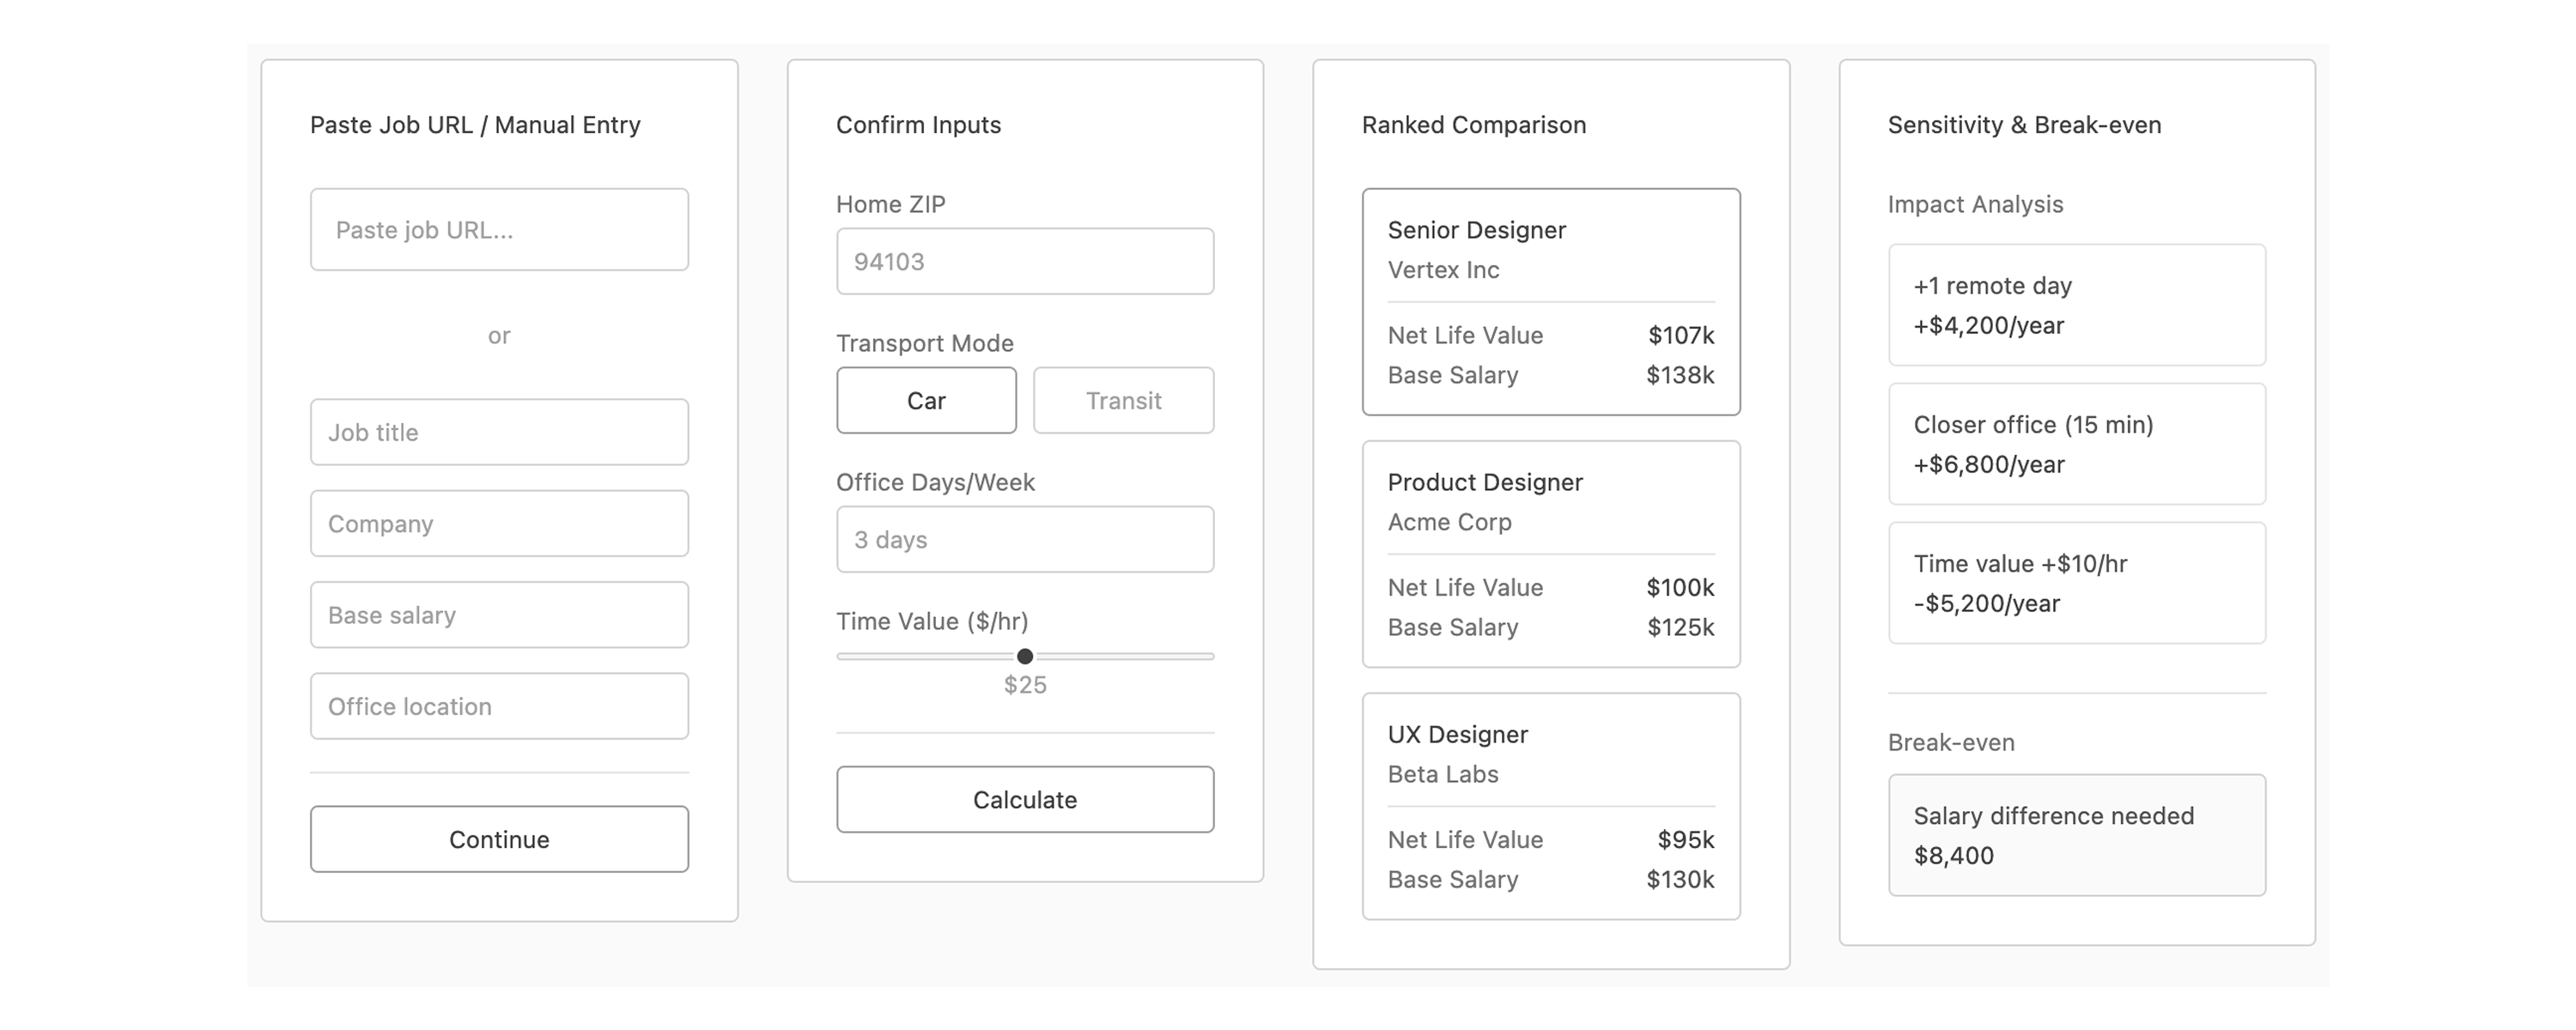
No 9Output Experience
Results are presented as a structured comparison dashboard - emphasizing clarity, modeled ranges, and decision transparency.
The system highlights life-adjusted value, commute burden, and break-even thresholds - while surfacing assumptions and confidence bands.
AI assists in extraction and modeling, but outputs remain interpretable and grounded in visible inputs.
No 10Product Evolution
v1: Two-job comparison. The original CompLens required two job offers to be useful. Users entered both roles and the tool ranked them by life-adjusted value. It worked for people actively comparing offers but excluded anyone in a current job who simply wanted to understand what their commute was costing them.
The insight came from user testing. One tester said: "I don't have two jobs in front of me. I just want to know how much time I'm wasting commuting to the one I have." That reframe was immediate and obvious in hindsight. The comparison use case is relatively rare, especially in a market defined by layoffs and limited options. The single-job calculation opens CompLens to a much larger audience: existing employees re-evaluating their current role.
v2: Single job first, comparison optional. The updated flow starts with one job. The user sees their commute cost clearly before deciding whether to add a second role for comparison. The tool works for anyone, not just people with two offers in hand.
No 11Strategic Reflection
The modern labor market encodes compensation - but not life efficiency.
When trade-offs remain invisible, decisions default to salary. When trade-offs become legible, decisions become deliberate. CompLens does not attempt to change job supply or workplace policy. It changes the decision frame.
- Reframes job comparison from gross salary to life-adjusted value.
- Creates negotiation leverage through quantified trade-offs.
- Operates as a thin modeling layer - not a competing job platform.
- Demonstrates how small framing shifts can influence large life outcomes.
At scale, clearer decisions may also yield secondary effects - reduced commute emissions, lower congestion, increased time affluence, and improved personal wellbeing. But those are outcomes of better modeling, not the primary pitch.
Extended research synthesis, behavioral analysis, and modeling rationale are documented separately and available upon request.
Designed and built independently · React + Vercel · Iterated based on user testing
Try the live tool →